Every signal in.
Only what matters out.
Because the person who gets paged deserves the answer, not just the alert.
Your team gets paged at 3 AM. Forty-seven minutes later, someone finds a misconfigured connection pool. SaviourOps tells you in 12 seconds. Same incident. Very different night.
Private BetaLimited spots available — no credit card required.
SaviourOps
Detect. Diagnose. Resolve.
Works with your existing stack
eBPF agent runs on Kubernetes, EC2, bare metal, and any Linux 5.8+ host. Accepts OTLP from any collector.
Sound familiar?
Incidents cost more than downtime.
They cost your team.
What if the page came with the answer attached?
Not a dashboard. Not a link to five dashboards. The actual cause, the affected services, and what to do next.
3 AM. You get paged.
47 minutes digging through dashboards. The CEO is asking for an update.
50 alerts fire at once.
Your team scrambles across 5 tools trying to find which alert is the real one.
Everyone joins the war room.
6 engineers, 3 hours, $18K in lost revenue — for a misconfigured connection pool.
Post-mortem says the same thing.
"We need better observability." Again.
Products
Your incidents.
Your infrastructure.
Your way.
Observability was supposed to tell you what's happening. Somehow it became three subscriptions, two dashboards, and a Slack channel called #incidents. These are the pieces we rebuilt — together.
01
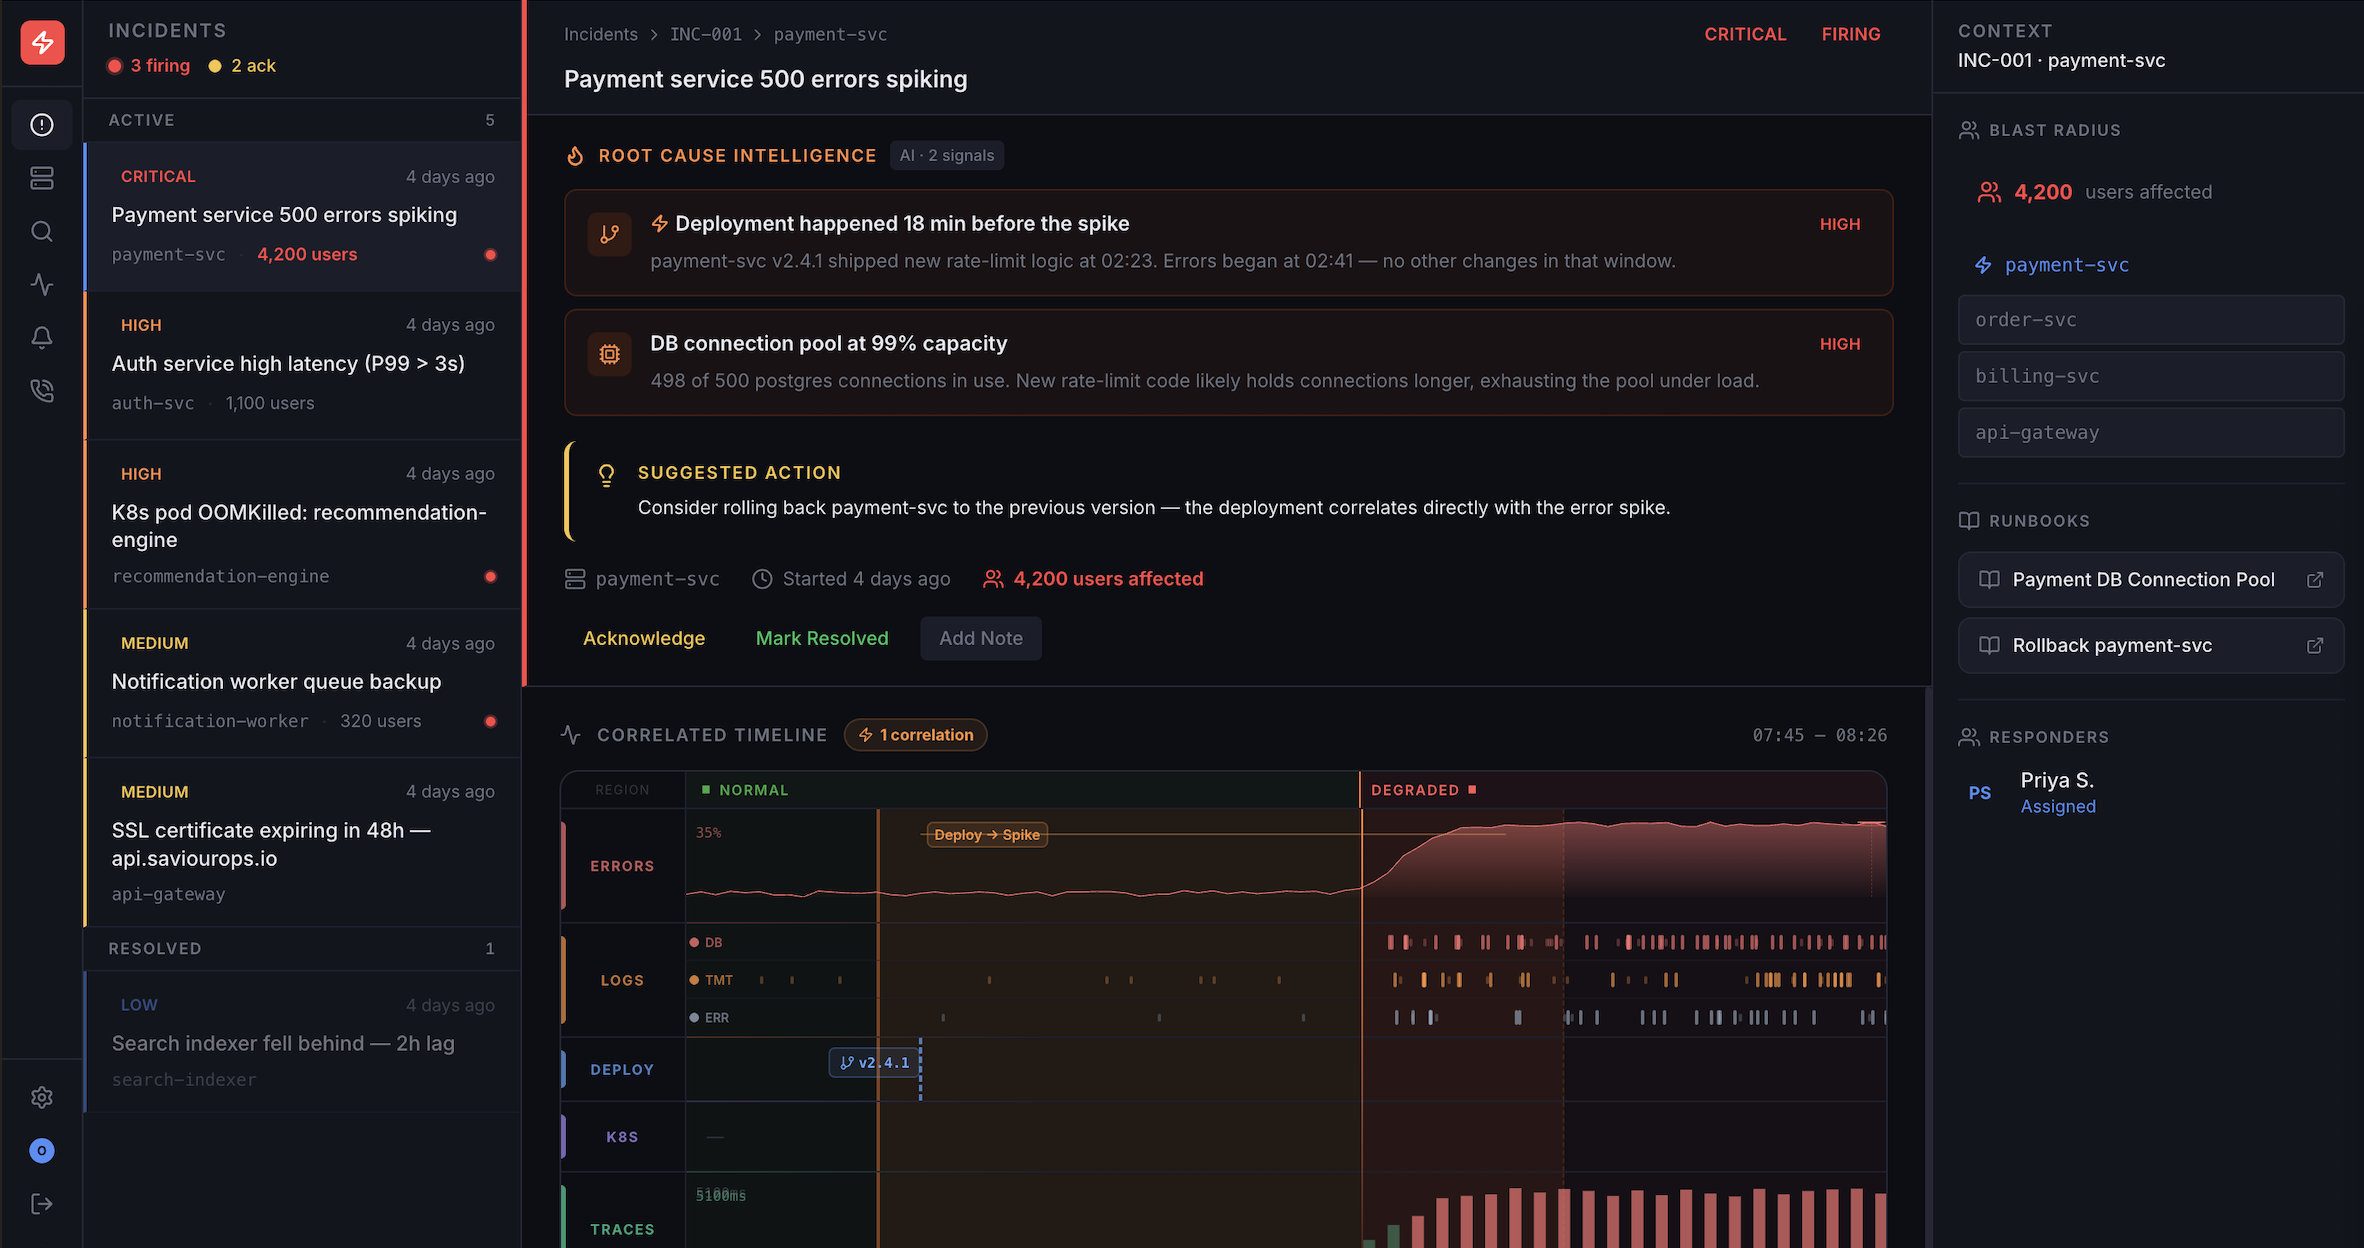
Incident Intelligence
01
Incident Intelligence
AI-powered root cause analysis that correlates alerts, identifies anomalies, and tells you exactly what broke and why — in seconds, not hours.
Root Cause Analysis
AI analyzes correlated signals across your stack to pinpoint the exact root cause automatically.
Alert Correlation
50 alerts become 1 incident. Smart grouping eliminates noise so you focus on what matters.
Suggested Fixes
Get actionable remediation steps based on the diagnosis — not just what broke, but how to fix it.
02
Infrastructure Visibility
02
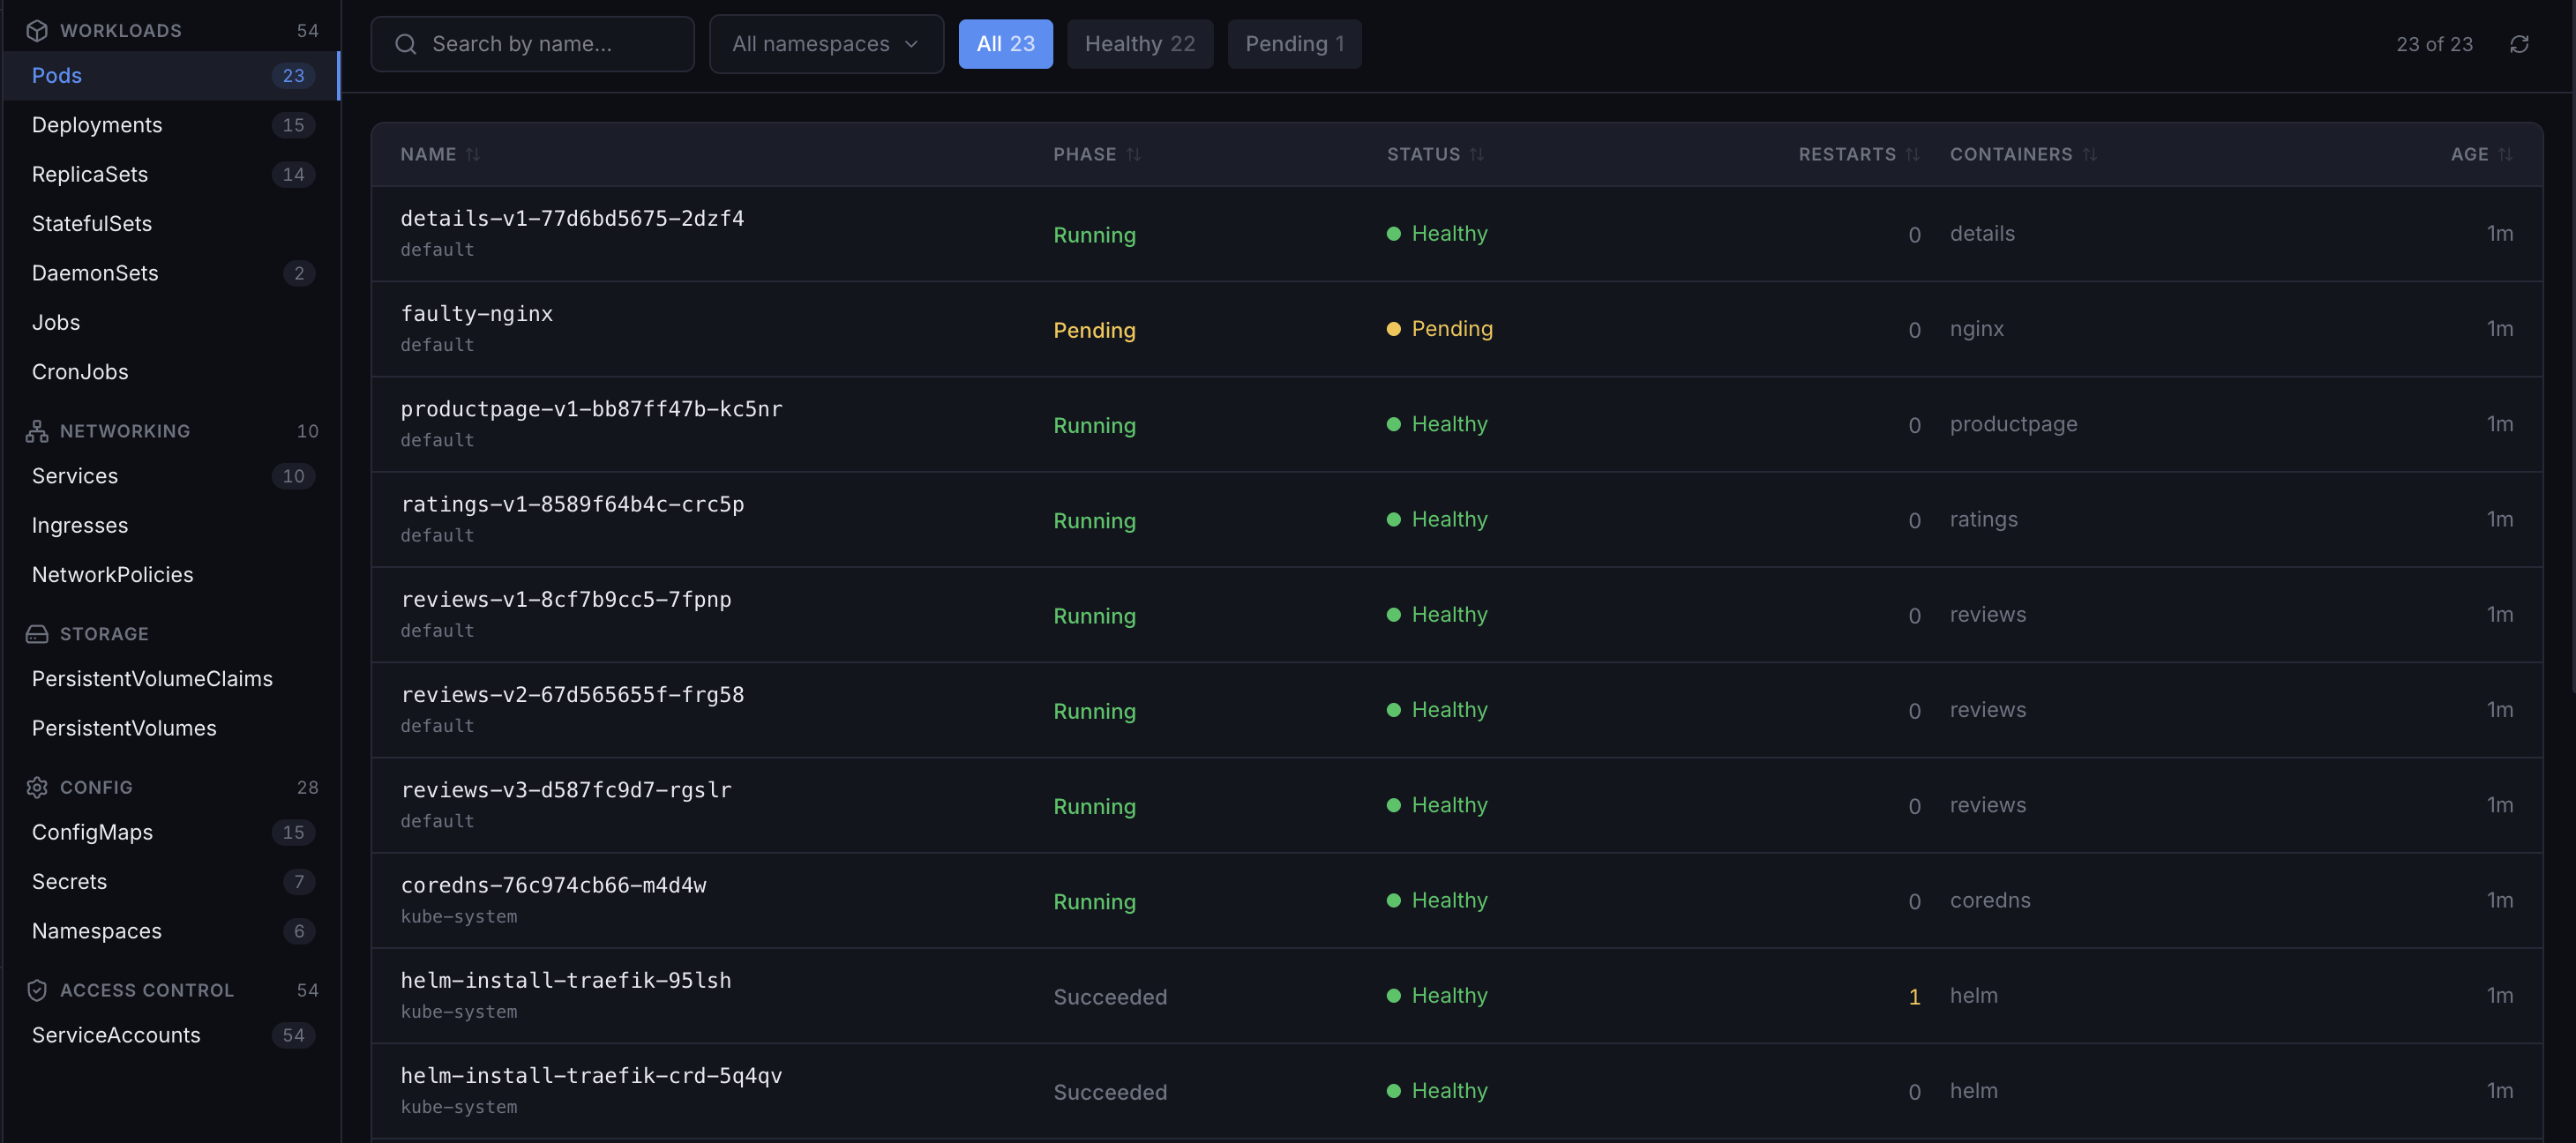
Infrastructure Visibility
Kubernetes clusters, EC2 instances, bare-metal nodes, VMs — one agent covers all of it. Pods, deployments, node pressure, service topology, and host-level metrics in the same place, whether your workload is containerized or not.
Kubernetes-Native
Pod status, deployment health, node pressure, HPA scaling events — pulled from the kube-apiserver and enriched with eBPF network flows. No DaemonSet YAML to write.
EC2 & Bare Metal
The same eBPF agent runs on any Linux 5.8+ host — EC2 instances, bare-metal servers, VMs. CPU, memory, disk I/O, and network flows alongside your Kubernetes nodes.
Service Topology
East-west traffic between services mapped automatically from socket probes. Works across K8s and non-K8s hosts — no service mesh, no annotation changes.
03
On-Call Management
03
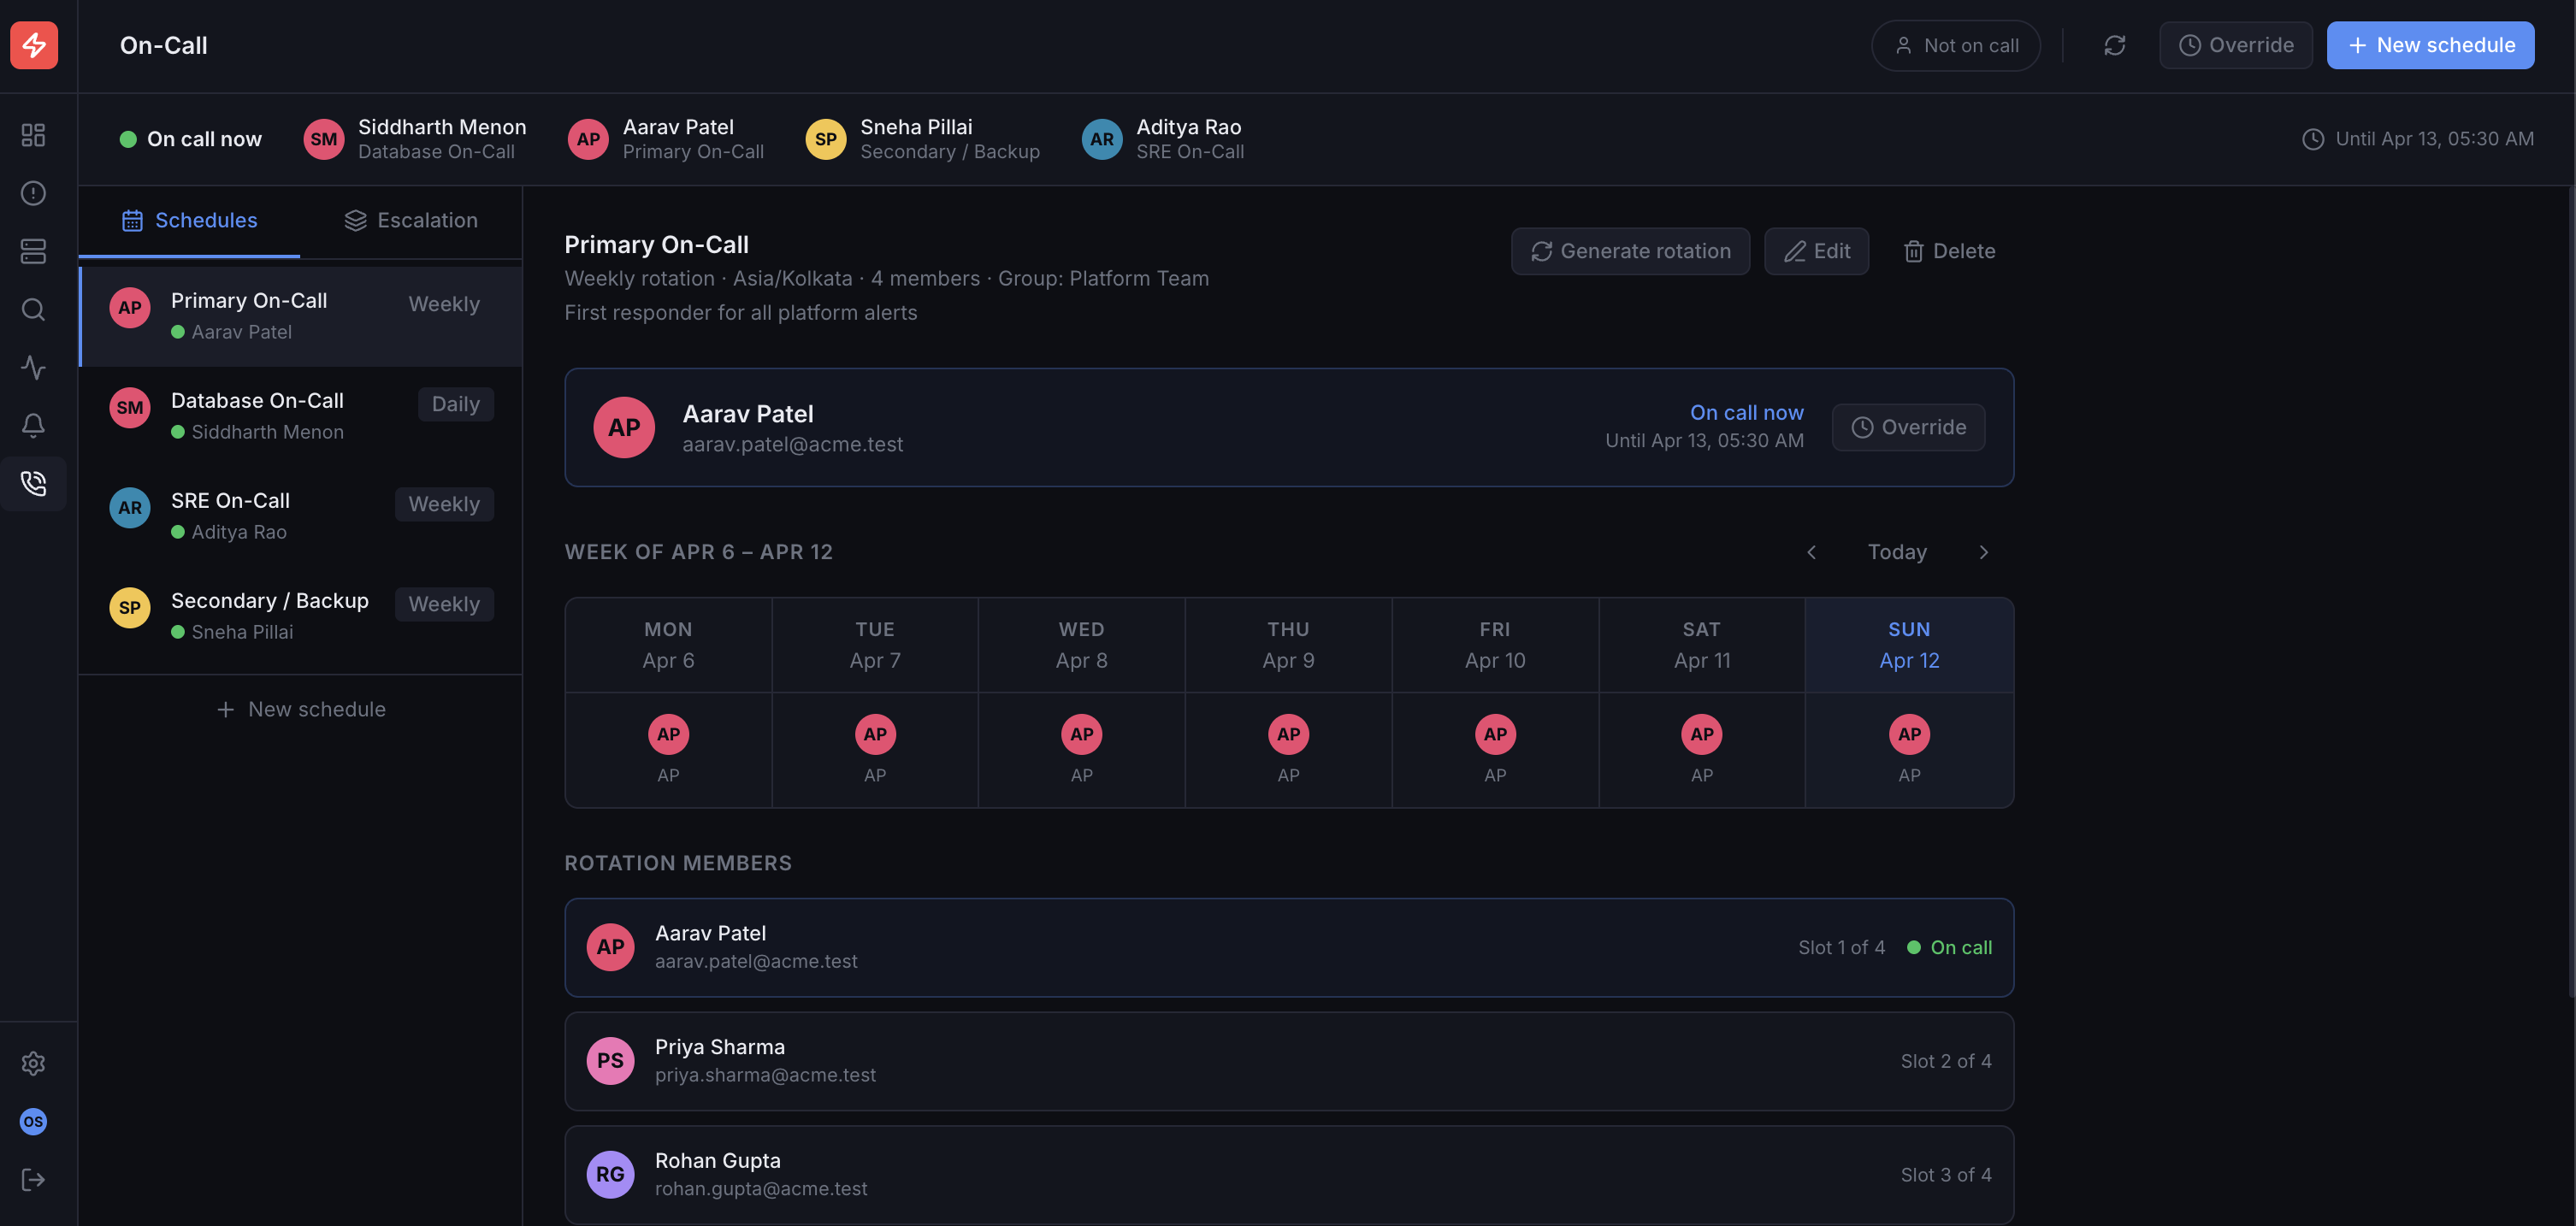
On-Call Management
Schedules, rotations, and escalation policies — all in one place. Know who’s on call, when, and make sure the right person gets paged every time.
Smart Scheduling
Create rotation schedules with automatic handoffs, overrides, and holiday coverage.
Escalation Policies
Multi-tier escalation ensures incidents never go unacknowledged — route to Slack, PagerDuty, or phone.
Team Visibility
See who’s on call right now across every team and service. No more guessing or Slack pings.
04
Uptime & SSL Monitoring
04
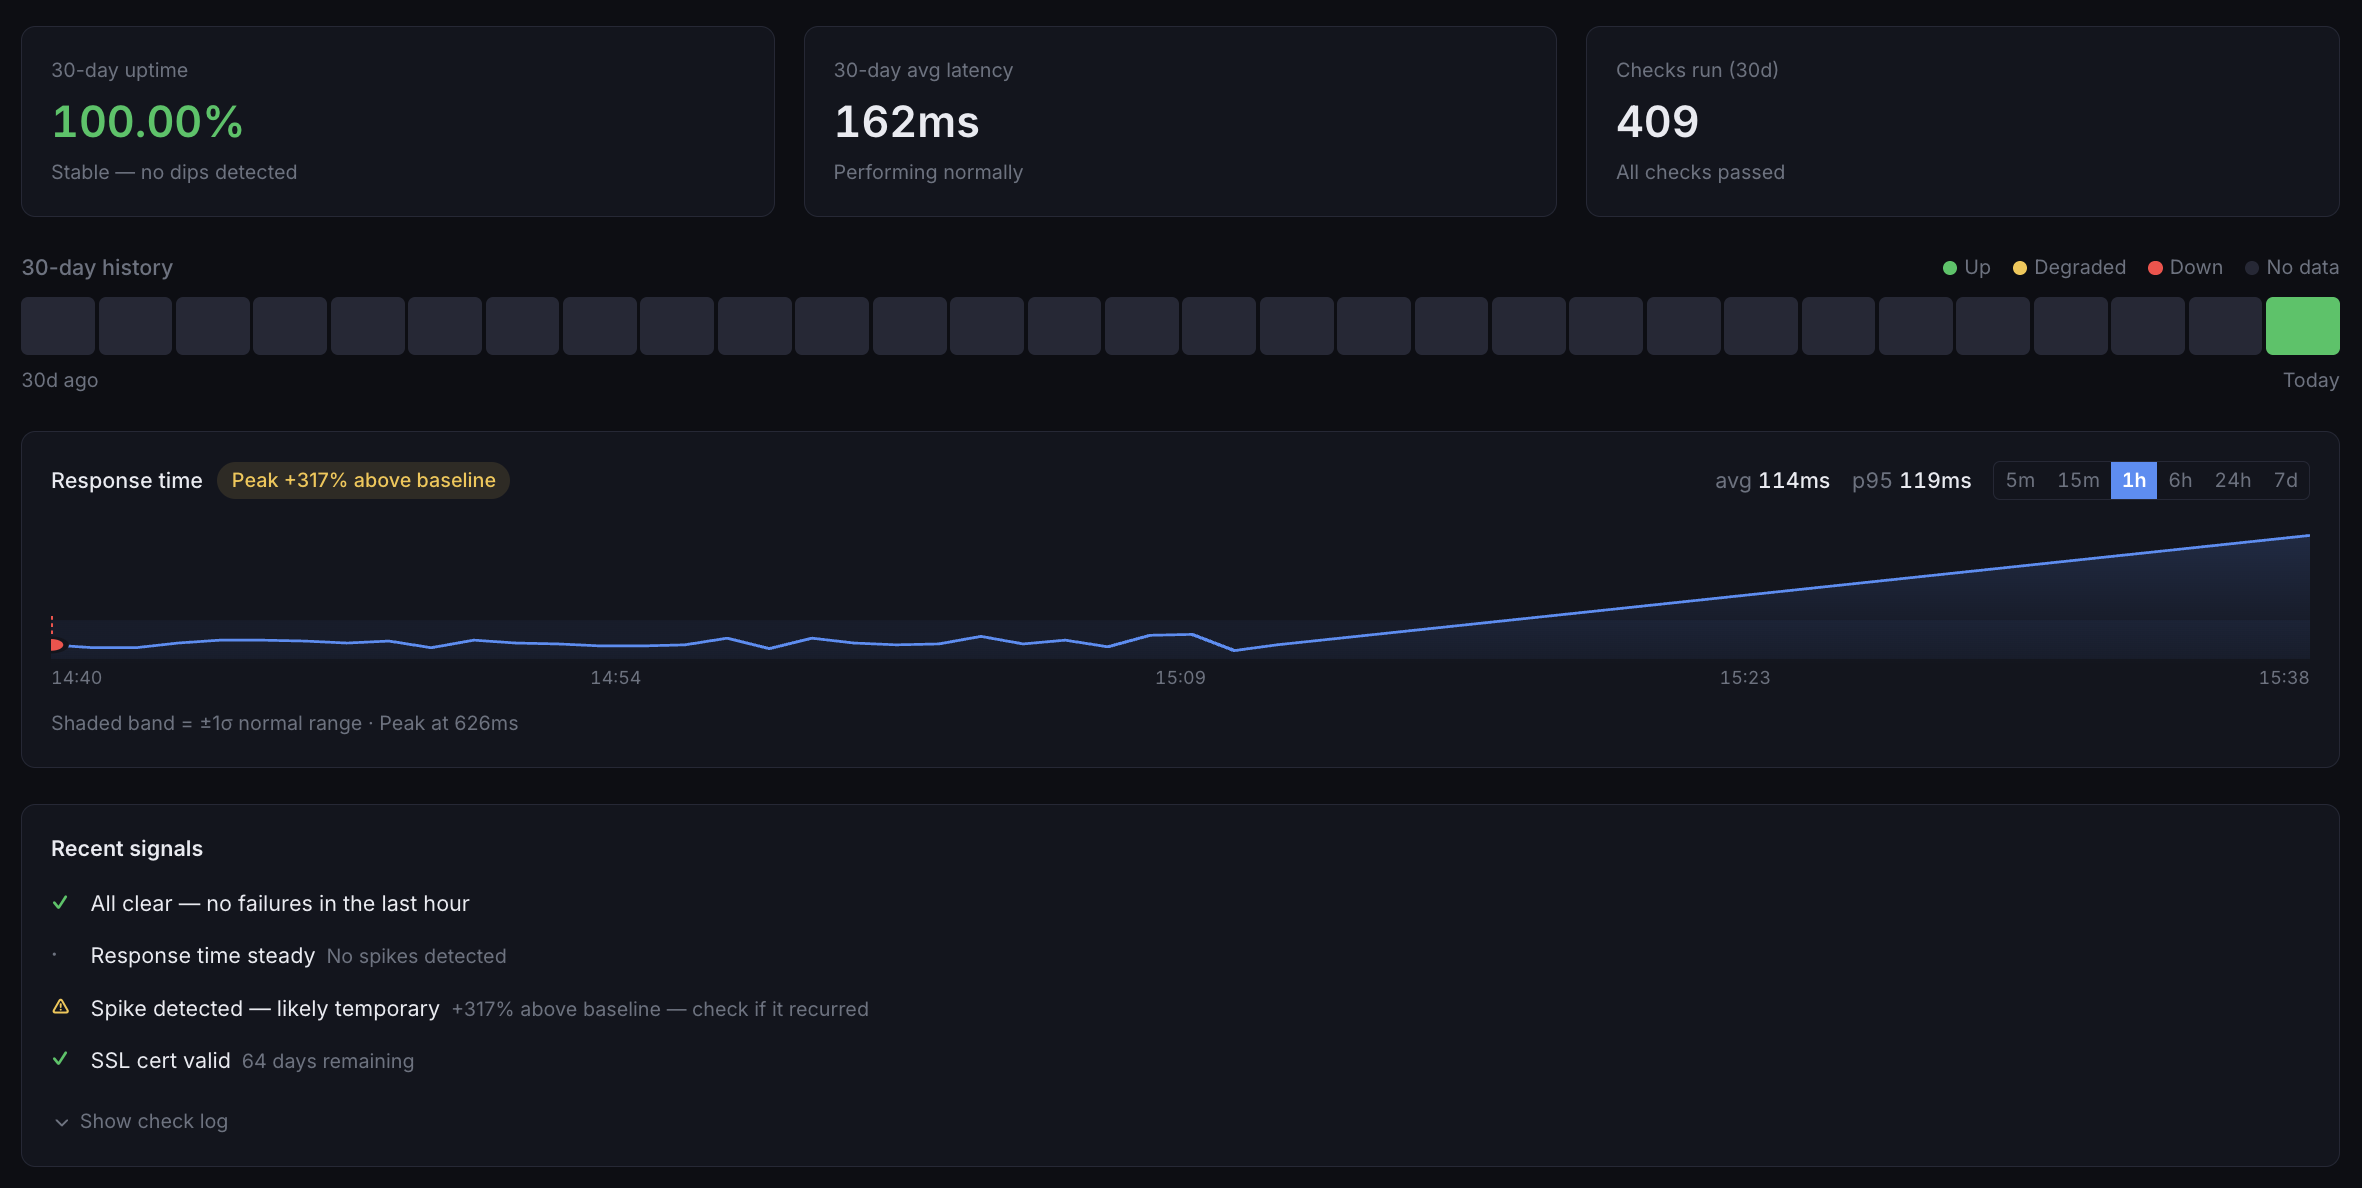
Uptime & SSL Monitoring
Monitor your websites, APIs, and services from multiple global locations — and track SSL certificate health across all your domains. Know the moment something goes down or a cert is about to expire.
Global Uptime Checks
Monitor from 20+ locations worldwide with HTTP, TCP, DNS, and ICMP checks. Detect outages instantly.
SSL Certificate Tracking
Automated alerts before certificate expiration. Validate chain integrity and catch misconfigurations early.
Instant Alerts
Get notified via Slack, email, or webhook within seconds of downtime or SSL issues. No more surprises.
05
LLM Observability
05
LLM Observability
Coming soonProduction monitoring for AI pipelines. Trace every LLM call, track token usage and cost per request, catch latency regressions, and get paged when your AI service degrades — the same way you'd monitor any critical service.
LLM Call Tracing
Full distributed traces across your AI pipeline — from API gateway to model call to response. Works via OTLP or native agent integration.
Token & Cost Monitoring
Token usage, spend per model, and cost anomaly detection. Know before your bill does when usage spikes unexpectedly.
Incident Detection
Auto-detect when p95 latency crosses threshold, error rate spikes, or a model becomes unavailable. Get paged. Get context. Fix it fast.
Coming soon
LLM Observability is in active development. Early access available — reach out to join the beta.
In practice
Numbers from teams who shipped through it.
minutes to fix
Average time-to-resolution, before vs. after
to surface the root cause
eBPF captures what happened at the kernel, not the symptom
incident card. Not 50 alerts.
Correlation collapses the noise so you see what actually broke
SDK changes required
Deploy the agent. It starts tracing. That's it.
Figures reflect design targets from internal testing. Your environment, your results.
Pricing
One meter. One price.
No tiers.
$0.30 per GB ingested. Everything included — AI root cause analysis, eBPF tracing, on-call, unlimited seats. Start free with 3 GB/month forever. No credit card. No upgrade cliff. No vendor lock-in.
FREE · FOREVER
3 GB / month. No credit card.
- 3 GB ingestion per month
- 3 team members
- 7-day data retention
- All features — eBPF, AI RCA, on-call
- Community + email support
PAY-AS-YOU-GO
First 3 GB free. Everything included.
- AI root cause analysis — unlimited (fair-use 100/day)
- eBPF zero-instrumentation tracing
- On-call schedules + escalation policies
- Unlimited users, dashboards, alerts
- Unlimited monitored nodes
- Up to 50 uptime monitors included
- 30-day data retention
- Slack, Teams, email, webhook, PagerDuty
- Data export — OTLP, Parquet, ClickHouse native
ENTERPRISE
For regulated, large, or BYOC deployments.
SSO (SAML/SCIM), audit log, 90+ day retention, HIPAA/SOC 2 DPA, private LLM, BYOC in your AWS/GCP/Azure, dedicated CSM, custom SLA.
COST ESTIMATOR
Estimated monthly cost
$29.10
(97 GB billable × $0.30 · 3 GB free)
Real situations
What actually happens at 3 AM.
Four situations every on-call engineer knows. One consistent problem: the tools don't tell you what you need to know.
Without SaviourOpsPagerDuty fires. You open Datadog, Grafana, and your logs tab. 47 minutes later you find a misconfigured connection pool.
With SaviourOpsSaviourOps fires. Root cause is on screen in 12 seconds. You push the fix, close your laptop.
On-call SRE
Without SaviourOps200 alerts fire simultaneously. Your team burns three hours correlating which one actually matters. Revenue is gone.
With SaviourOpsOne incident card. AI correlates the noise, pins the blast radius, surfaces the three signals that matter.
Platform Lead
Without SaviourOpsYour CTO asks for reliability numbers. You pull data from four tools, manually stitch it, and it's still wrong.
With SaviourOpsOne dashboard. One source of truth. MTTR, error rate, on-call load — all in one place.
Engineering Manager
Without SaviourOpsDatadog: $1,200/mo. PagerDuty: $420/mo. Grafana Cloud: $160/mo. That's $1,780 for what's still a broken process.
With SaviourOpsSaviourOps: $30/mo for the same 100 GB. Everything included. One invoice.
CTO / Founder
Your next incident is coming.
Answer it in seconds.
No dashboards to stitch together. No PagerDuty invoice. Deploy in minutes and stop dreading the pager.
Free tier available. No credit card. No sales calls unless you want one.