Everything you need.
Nothing you don't.
Products
Your incidents.
Your infrastructure.
Your way.
Observability was supposed to tell you what's happening. Somehow it became three subscriptions, two dashboards, and a Slack channel called #incidents. These are the pieces we rebuilt — together.
01
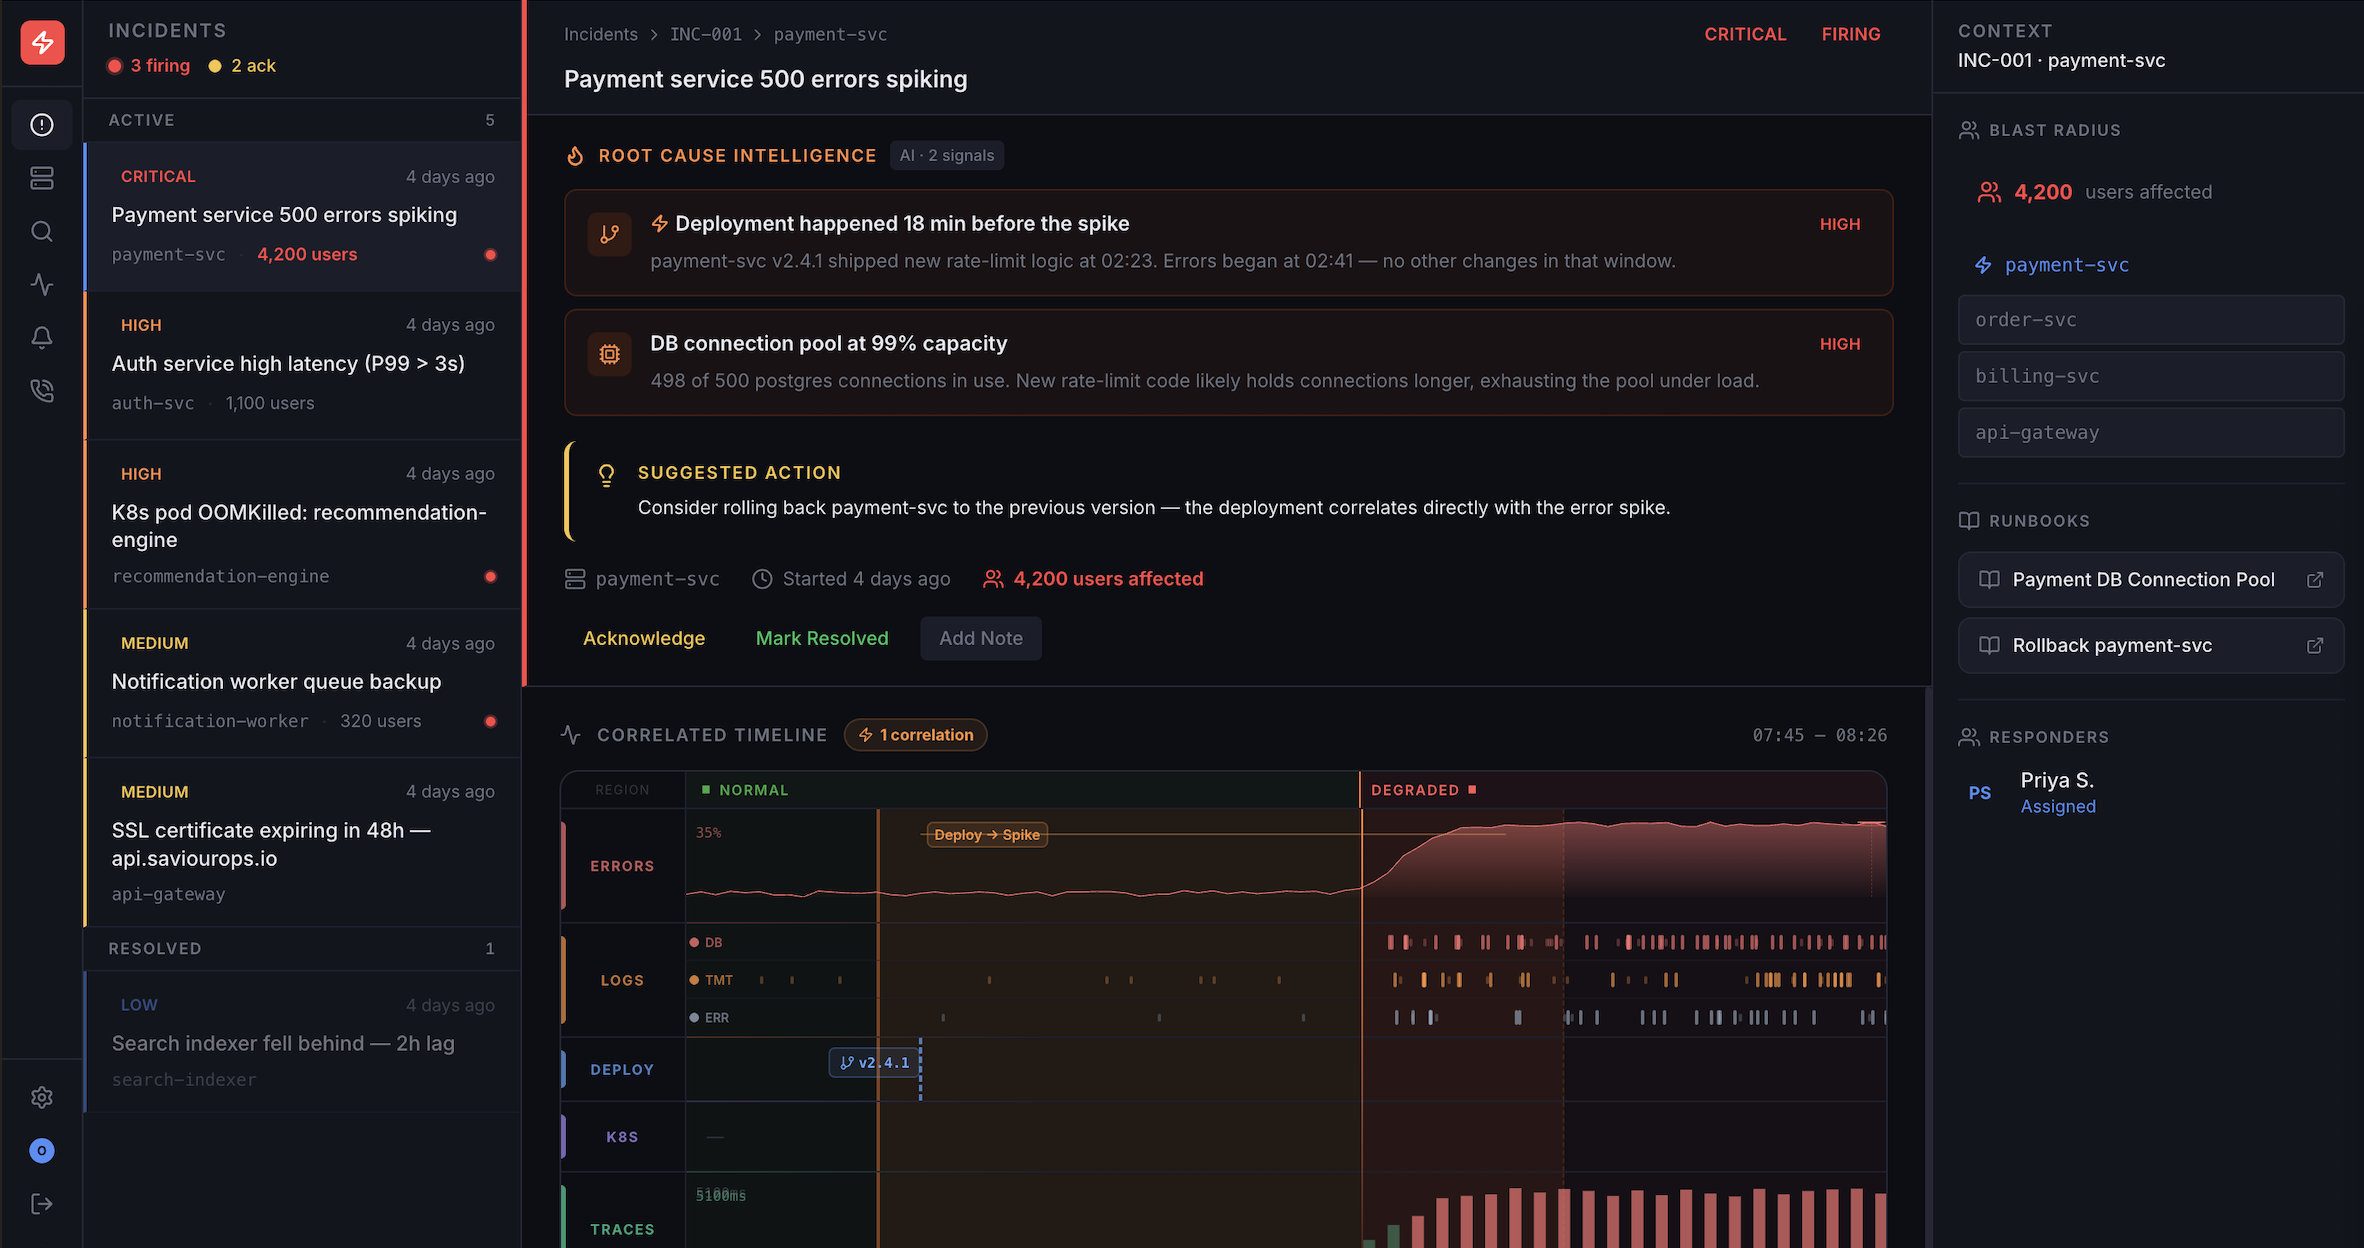
Incident Intelligence
01
Incident Intelligence
AI-powered root cause analysis that correlates alerts, identifies anomalies, and tells you exactly what broke and why — in seconds, not hours.
Root Cause Analysis
AI analyzes correlated signals across your stack to pinpoint the exact root cause automatically.
Alert Correlation
50 alerts become 1 incident. Smart grouping eliminates noise so you focus on what matters.
Suggested Fixes
Get actionable remediation steps based on the diagnosis — not just what broke, but how to fix it.
02
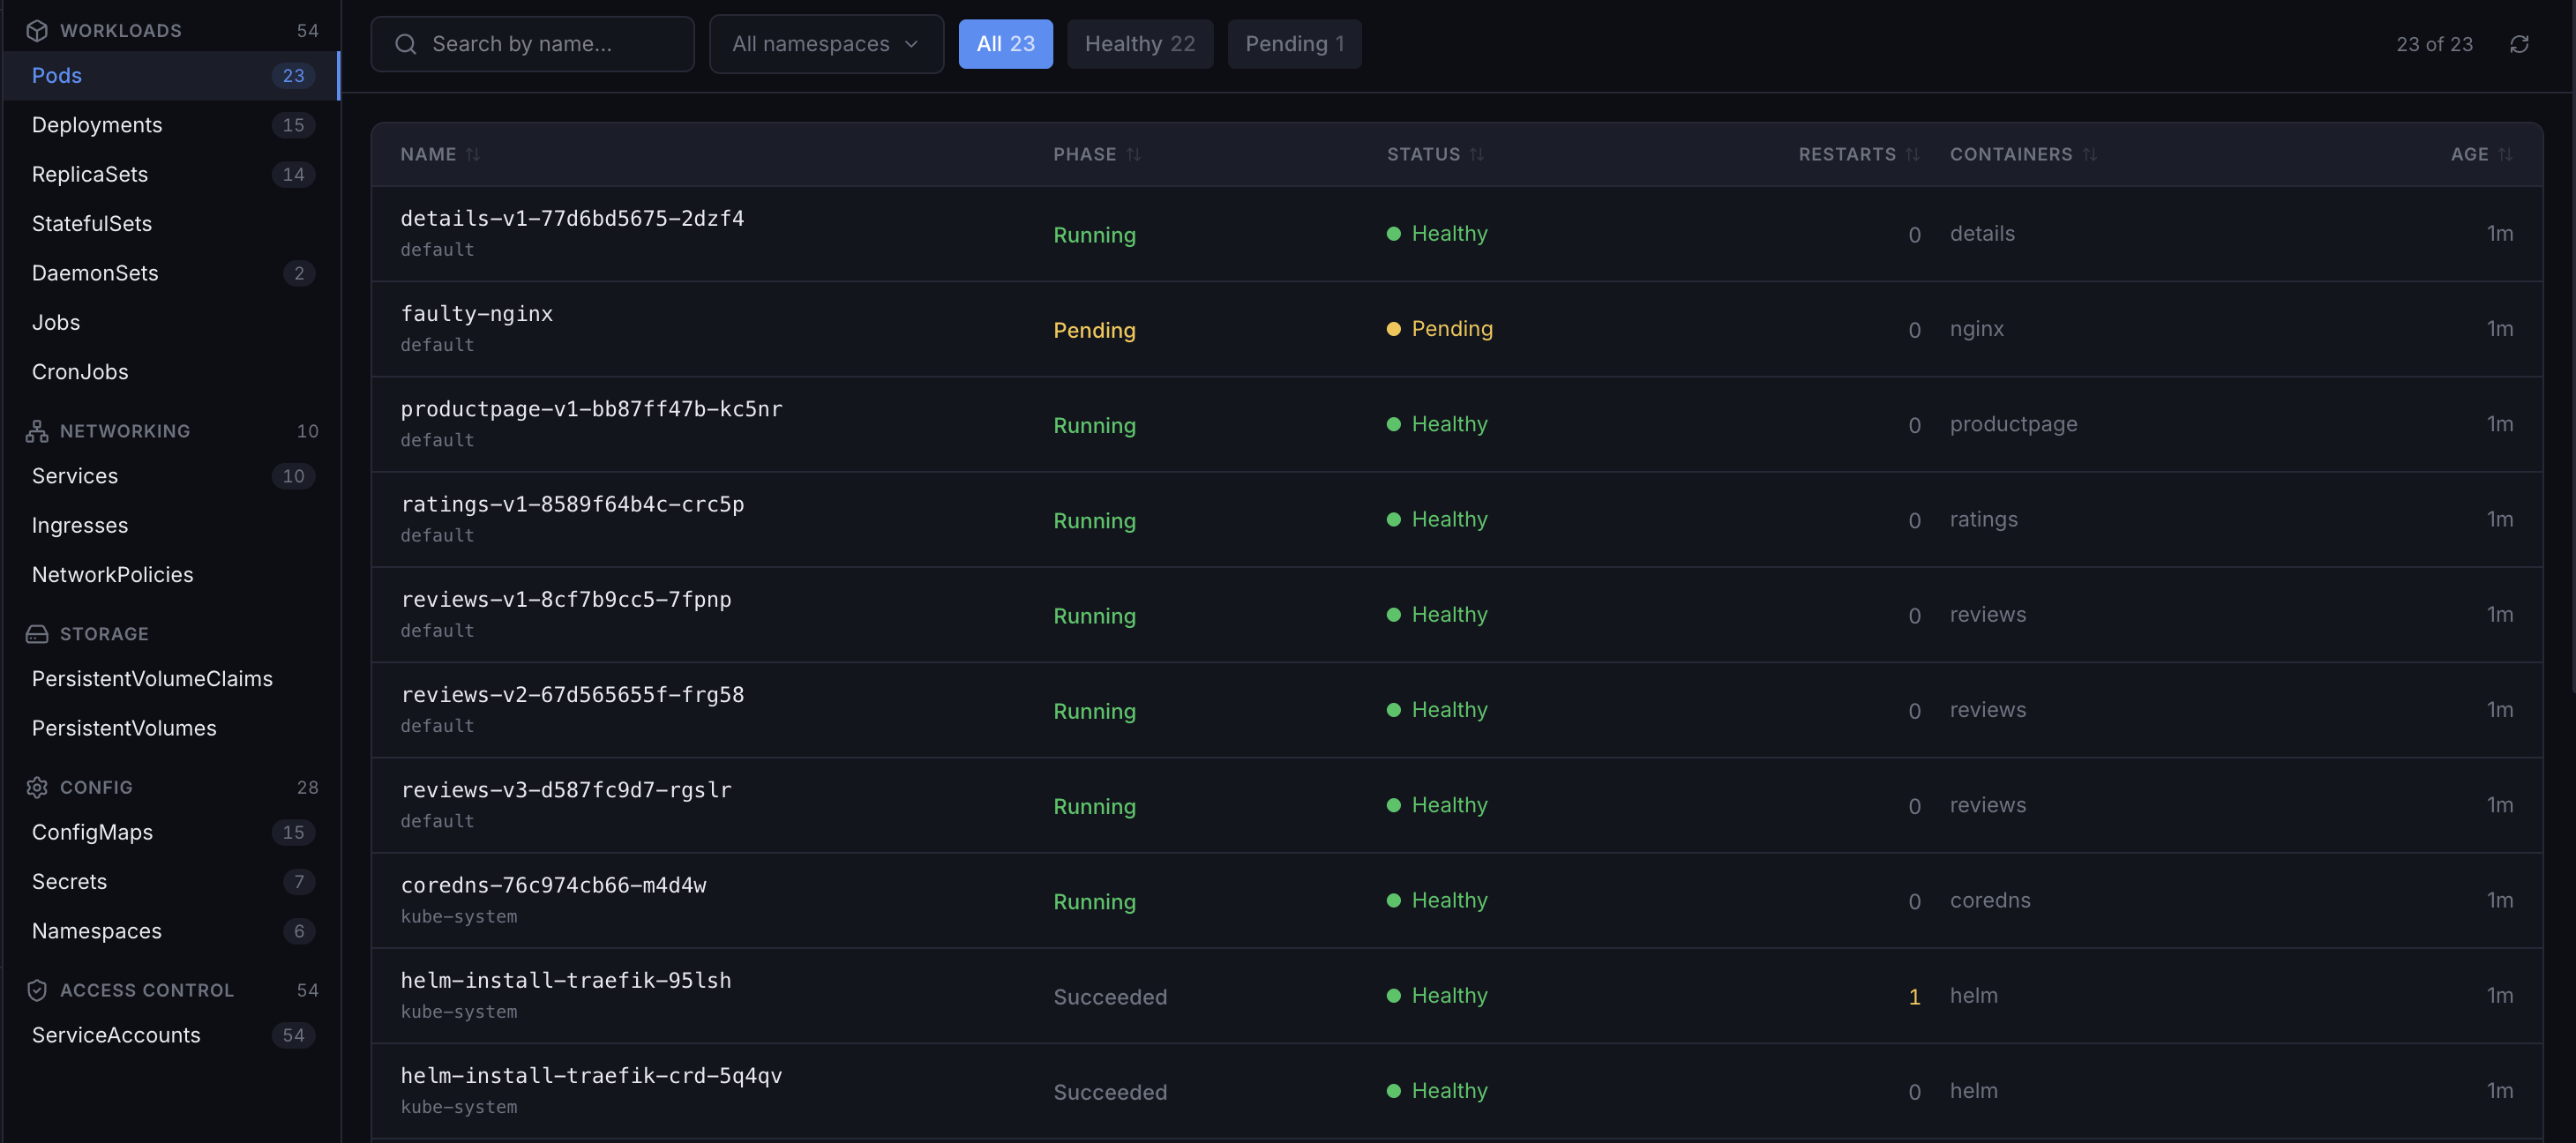
Infrastructure Visibility
02
Infrastructure Visibility
Kubernetes clusters, EC2 instances, bare-metal nodes, VMs — one agent covers all of it. Pods, deployments, node pressure, service topology, and host-level metrics in the same place, whether your workload is containerized or not.
Kubernetes-Native
Pod status, deployment health, node pressure, HPA scaling events — pulled from the kube-apiserver and enriched with eBPF network flows. No DaemonSet YAML to write.
EC2 & Bare Metal
The same eBPF agent runs on any Linux 5.8+ host — EC2 instances, bare-metal servers, VMs. CPU, memory, disk I/O, and network flows alongside your Kubernetes nodes.
Service Topology
East-west traffic between services mapped automatically from socket probes. Works across K8s and non-K8s hosts — no service mesh, no annotation changes.
03
On-Call Management
03
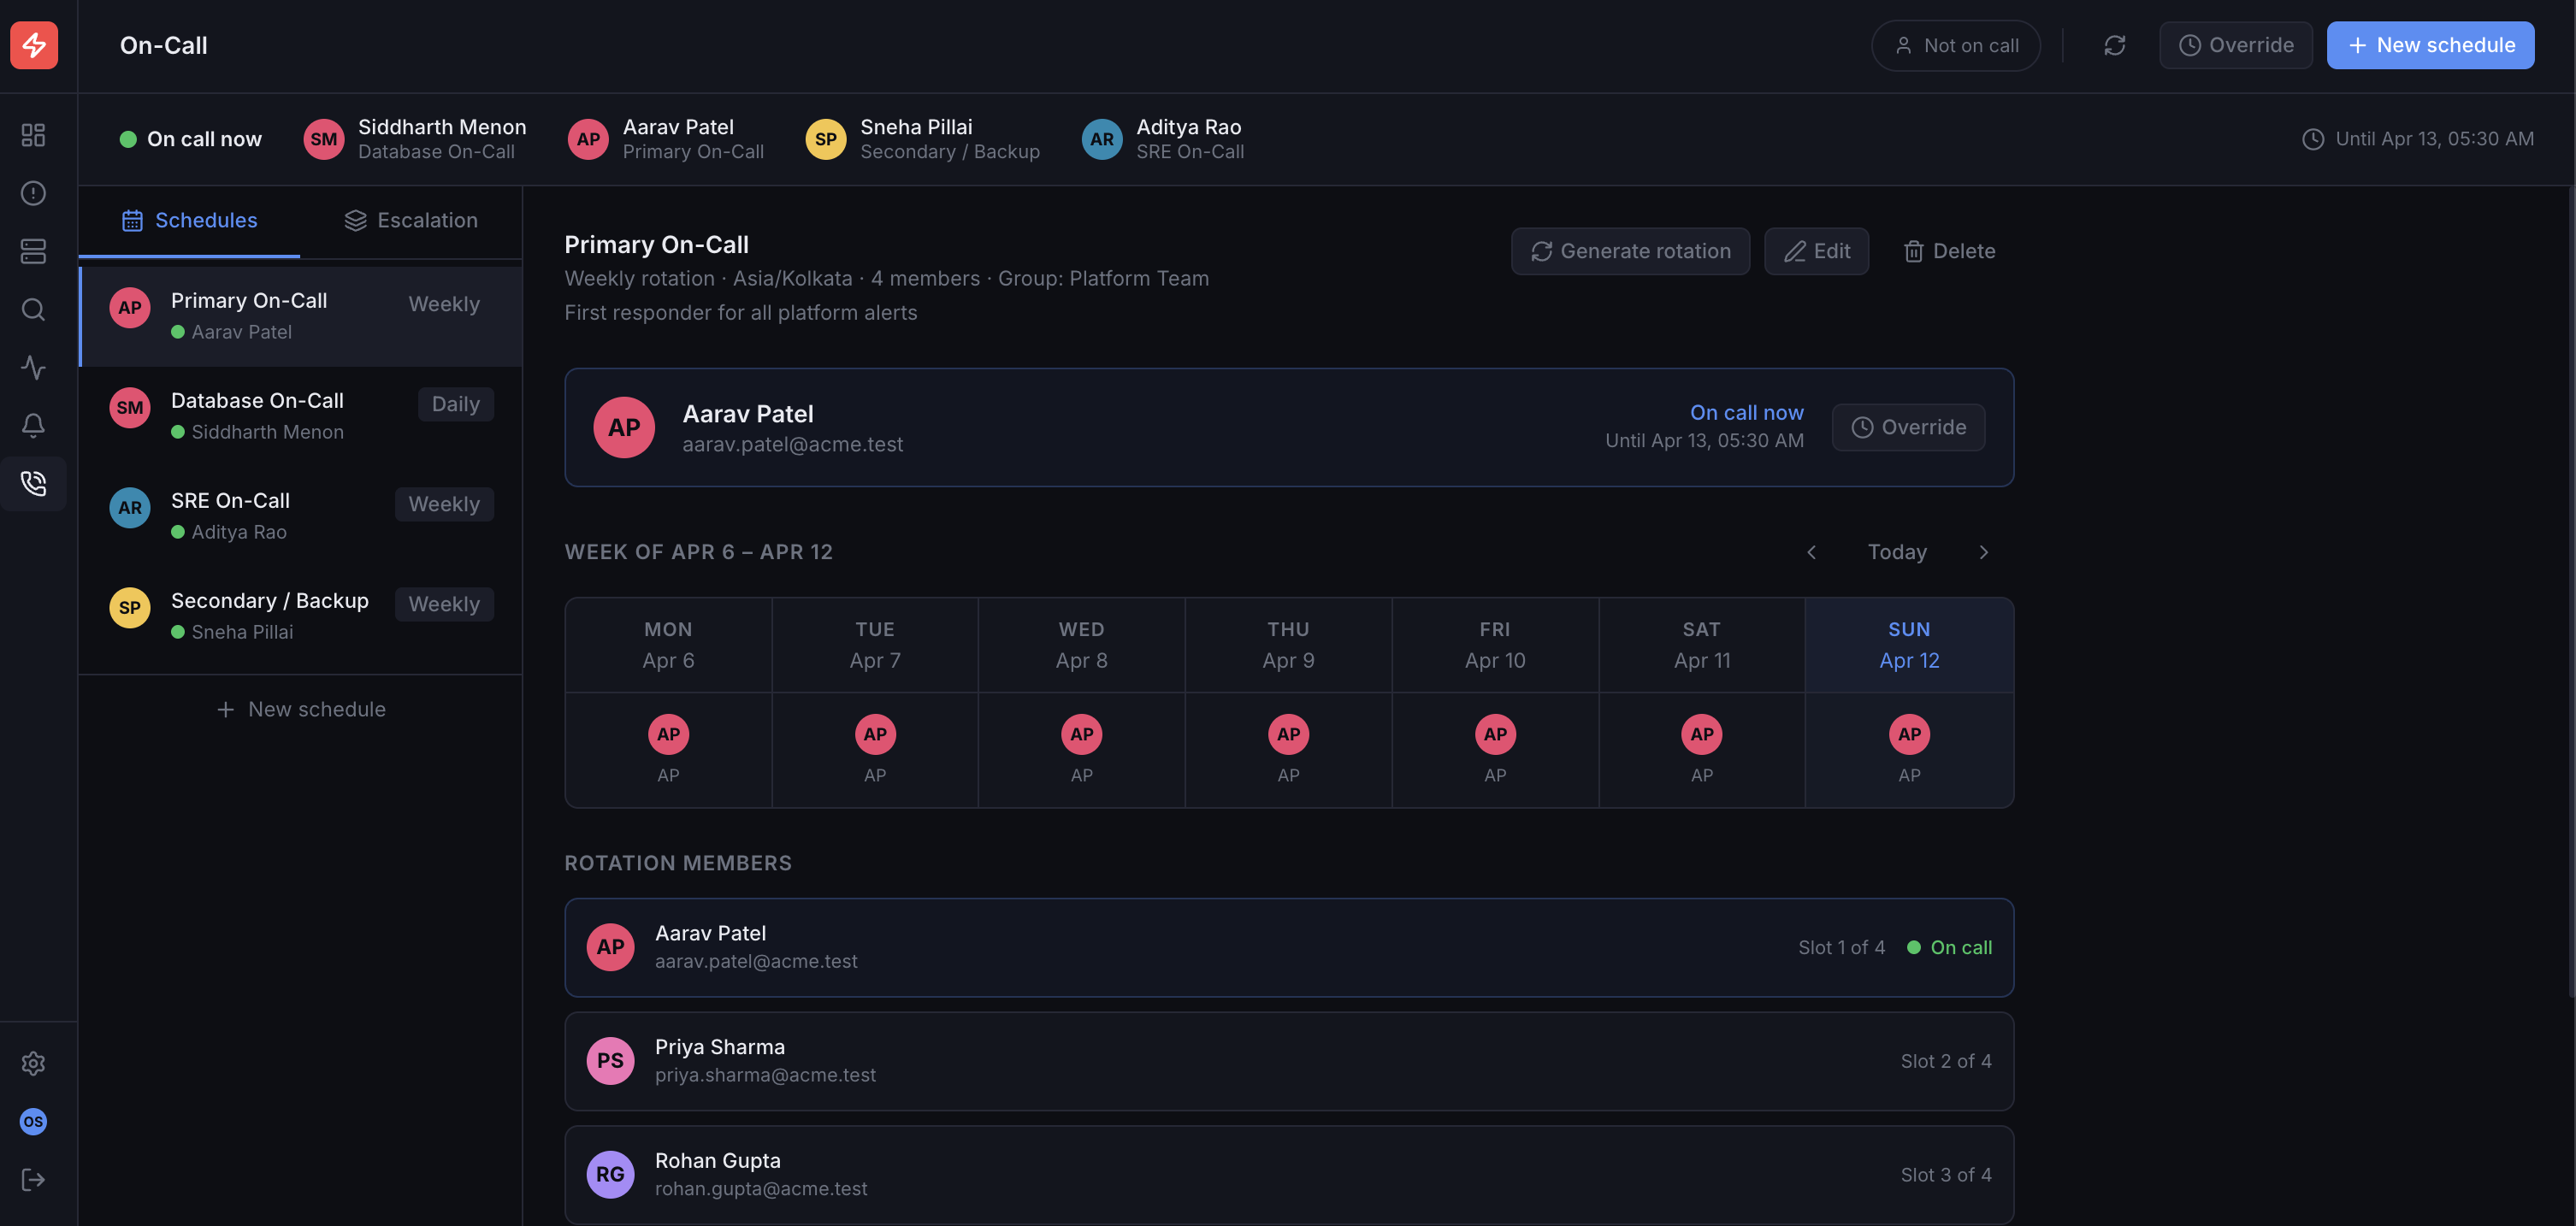
On-Call Management
Schedules, rotations, and escalation policies — all in one place. Know who’s on call, when, and make sure the right person gets paged every time.
Smart Scheduling
Create rotation schedules with automatic handoffs, overrides, and holiday coverage.
Escalation Policies
Multi-tier escalation ensures incidents never go unacknowledged — route to Slack, PagerDuty, or phone.
Team Visibility
See who’s on call right now across every team and service. No more guessing or Slack pings.
04
Uptime & SSL Monitoring
04
Uptime & SSL Monitoring
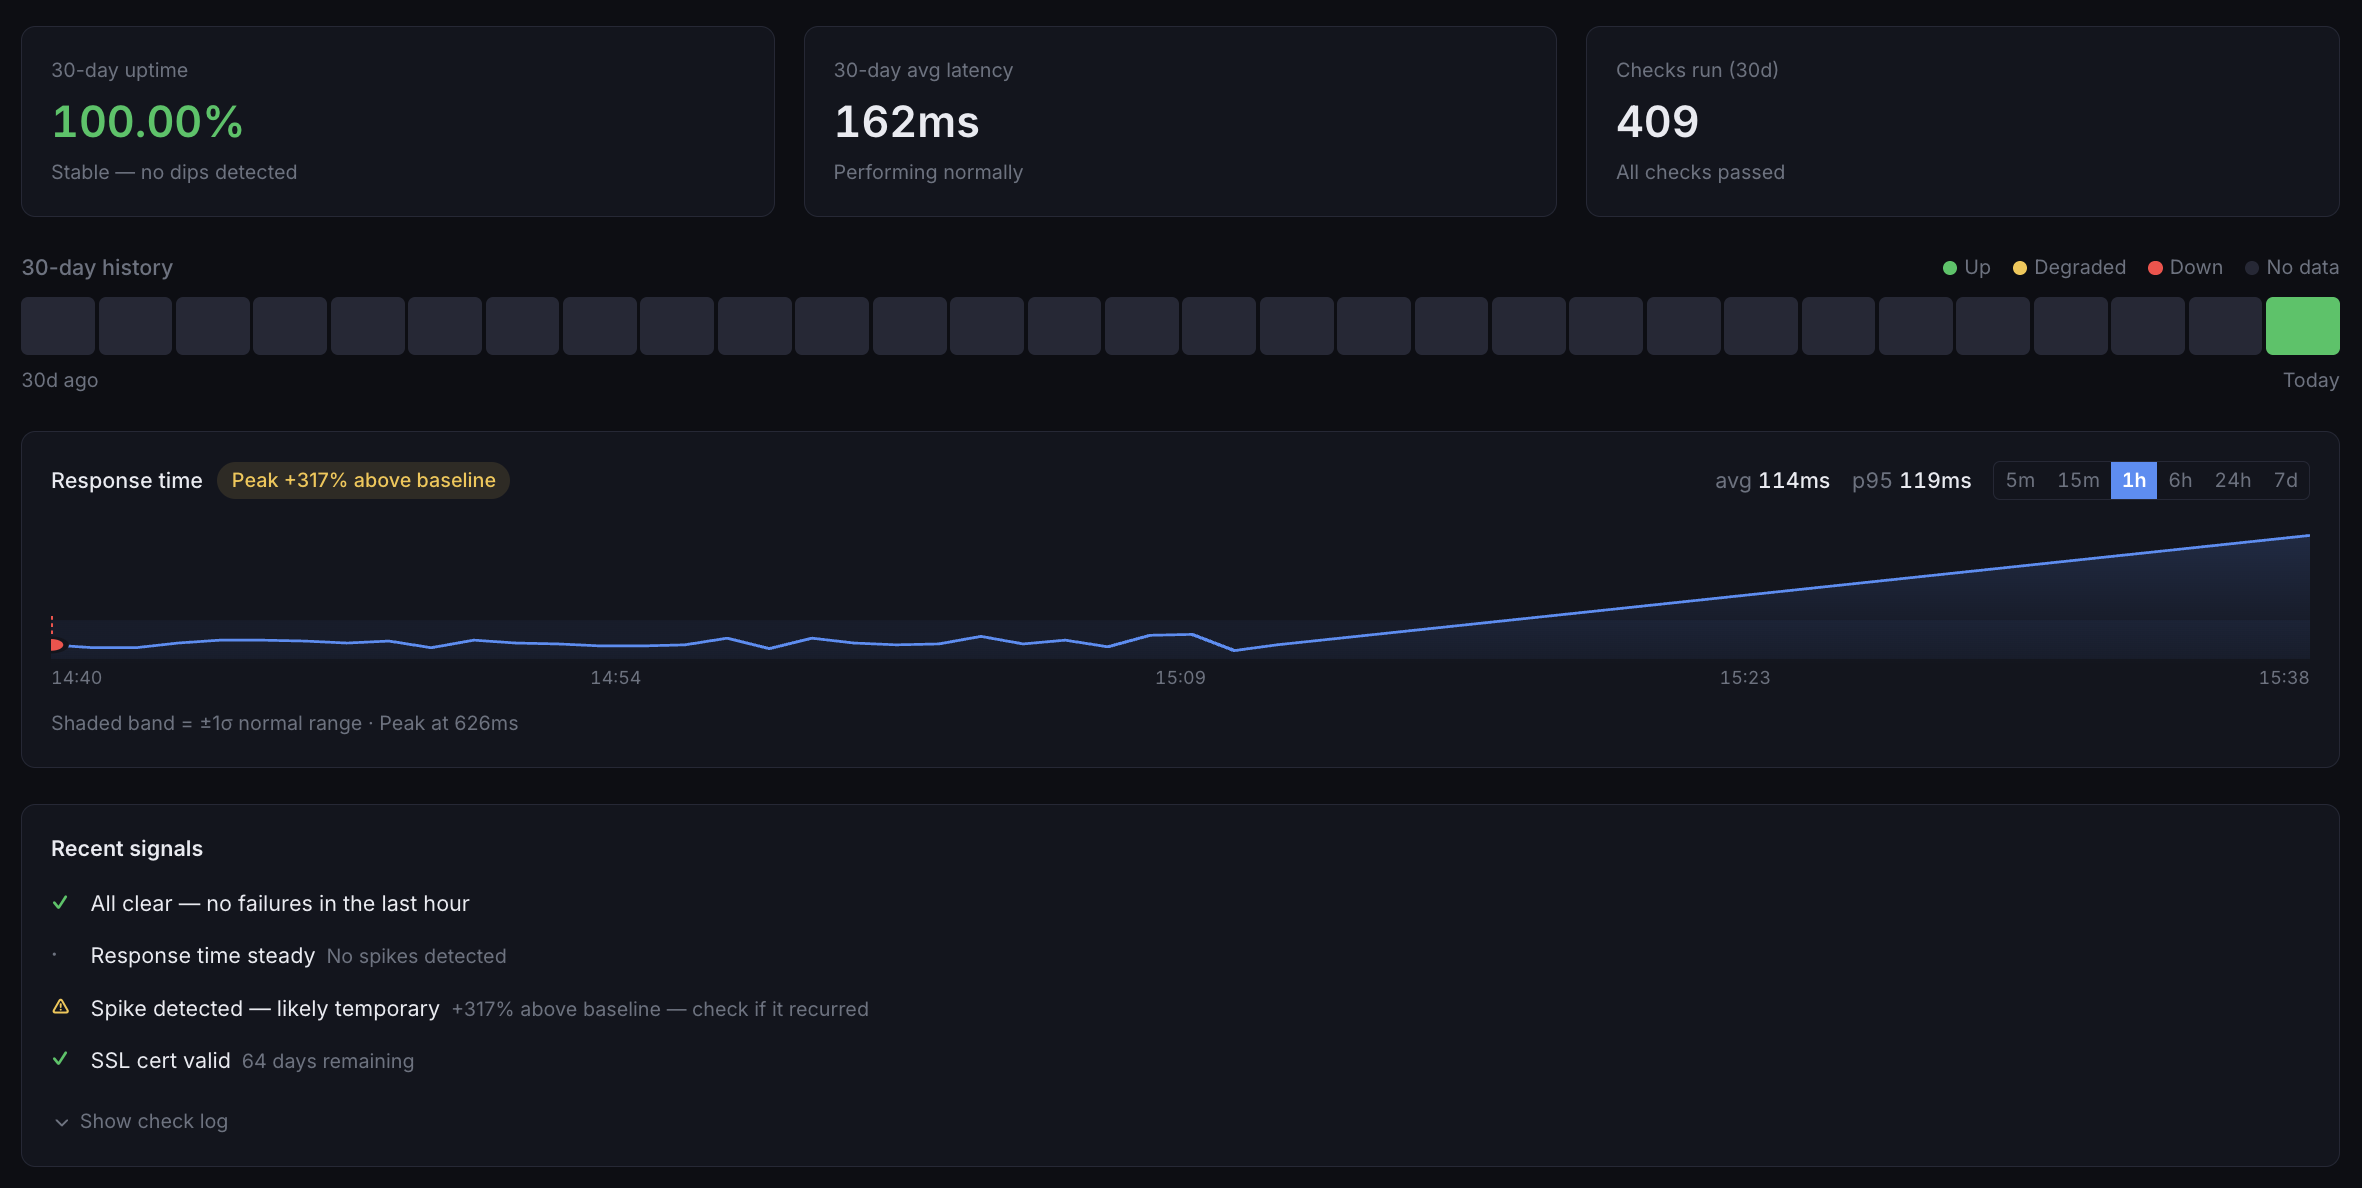
Monitor your websites, APIs, and services from multiple global locations — and track SSL certificate health across all your domains. Know the moment something goes down or a cert is about to expire.
Global Uptime Checks
Monitor from 20+ locations worldwide with HTTP, TCP, DNS, and ICMP checks. Detect outages instantly.
SSL Certificate Tracking
Automated alerts before certificate expiration. Validate chain integrity and catch misconfigurations early.
Instant Alerts
Get notified via Slack, email, or webhook within seconds of downtime or SSL issues. No more surprises.
05
LLM Observability
05
LLM Observability
Coming soonProduction monitoring for AI pipelines. Trace every LLM call, track token usage and cost per request, catch latency regressions, and get paged when your AI service degrades — the same way you'd monitor any critical service.
LLM Call Tracing
Full distributed traces across your AI pipeline — from API gateway to model call to response. Works via OTLP or native agent integration.
Token & Cost Monitoring
Token usage, spend per model, and cost anomaly detection. Know before your bill does when usage spikes unexpectedly.
Incident Detection
Auto-detect when p95 latency crosses threshold, error rate spikes, or a model becomes unavailable. Get paged. Get context. Fix it fast.
Coming soon
LLM Observability is in active development. Early access available — reach out to join the beta.
Your next incident is coming.
Answer it in seconds.
No dashboards to stitch together. No PagerDuty invoice. Deploy in minutes and stop dreading the pager.
Free tier available. No credit card. No sales calls unless you want one.